Power vs Energy Basics
kW and kWh show up on EV specs, charging screens, and utility bills, but they measure different things. kW is power, measured in kilowatts, and it describes the rate of energy transfer. kWh is energy, measured in kilowatt-hours, and it describes how much electricity is stored or consumed.
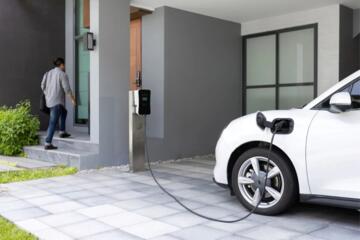
For a quick reality check, a 7.2 kW home charger can add about 7.2 kWh each hour under ideal conditions. A 60 kWh battery holds roughly 60 kWh, so the same charger would take around 8–9 hours to refill from empty, before charging losses. Charging losses vary by temperature and battery management, so the exact time changes.
Range estimates also tie back to energy use. Many EVs average around 0.25–0.35 kWh per mile (varies by vehicle and speed), so 300 miles can correspond to roughly 75–105 kWh used. That’s why vehicle type matters: a heavier SUV with larger wheels often consumes more kWh per mile than a smaller sedan.
Skip the unit guessing. It breaks trip planning.
Industry data backs the scale of the problem. In the U.S., the average retail electricity price is about $0.16 per kWh (varies by state and time-of-use plans). A 100 kWh charge can therefore cost roughly $16 in energy alone, before demand charges or fees. That cost sensitivity makes kWh the number that hits your wallet, while kW mostly affects how long you wait.
Where Buyers get Stuck
People often treat kW and kWh as interchangeable because both appear in charging menus. kW tells you how fast the charger can deliver power, but it does not tell you how much energy the battery needs. kWh tells you the energy content, but it does not tell you the charging speed at that moment.
Consequences show up fast on road trips. A station advertising 250 kW does not mean your EV will charge at 250 kW for the whole session. Battery temperature, state of charge, and thermal limits usually taper charging power as the battery fills. That taper can turn a “30-minute” marketing claim into a longer stop, especially after you start above 50%.
Financially, the confusion can lead to wrong expectations about charging cost. If you focus only on kW, you may underestimate the total kWh you pay for. If you focus only on kWh, you may misjudge how many charging stops you need, which affects time and sometimes parking fees.
Real-world example: a driver sees “150 kW” at a fast charger and assumes the battery gains 150 kWh per hour. That assumption is off by a factor of about 20, because 150 kW is a rate, not an energy total. The battery might gain 60–90 kWh in a long session, depending on the EV and how much you start with.
Skip the shortcut math. It misprices the trip.
Ownership costs also depend on how you charge. Home charging typically uses lower-cost electricity than public fast charging, but the charging speed (kW) determines how often you rely on public stations. Repair frequency is not usually tied to kW vs kWh directly, yet frequent fast charging can increase battery thermal cycling, and battery health outcomes vary by design and usage.
How to Read Specs and Plan
Match kW to your charger
Check the EV’s maximum charging power in kW and compare it to your available charger. If your home wallbox is 7.2 kW and the car supports 11 kW AC, the car will still charge at about 7.2 kW. In practice, that means overnight charging works, but “quick top-ups” depend on your schedule.
Look for the charger type too. AC charging power is limited by the onboard charger, while DC fast charging bypasses it. If you see “11 kW AC” on a spec sheet, that’s the car’s onboard limit, not the wallbox’s limit.
On a typical install, a 240V circuit with a 40A breaker can deliver about 9.6 kW, but local wiring and code rules may change the final number. I’ve seen EV owners assume a “240V outlet” equals fast charging, then discover the car only negotiates 1.4–3.7 kW through a basic Level 2 setup.
Skip the outlet guessing. Read the negotiated kW.
Use kWh to estimate cost
Estimate charging cost using kWh, not kW. Multiply the kWh you expect to add by your electricity price per kWh. If electricity is $0.16/kWh and you add 40 kWh, energy cost is about $6.40 before taxes and fees.
Charging sessions rarely transfer 100% of battery energy from the grid. Losses from the charger, battery charging efficiency, and heat management can add a few to several kWh per session. Cold weather can worsen losses, so the same “40 kWh added” may cost more than you expect.
For a concrete planning habit, track the “kWh delivered” number on the charging receipt. Many networks show this directly, and it’s the closest thing to a real-world kWh meter. I keep a spreadsheet with columns for delivered kWh and total cost; firmware updates in some apps changed how the receipt displays time stamps, which made my earlier logs messy.
Skip the sticker price math. Use delivered kWh.
Estimate time with taper
Use kW to estimate time, then adjust for taper. Fast charging power often drops as the battery approaches higher state of charge. If you start at 20% and charge to 80%, you may see higher average kW than if you start at 60% and charge to 90%.
Vehicle examples help. A Tesla Model 3 Long Range and a Hyundai Ioniq 5 can both advertise high peak DC power, but neither holds peak power for the full session. Even without quoting exact curves for every trim, the pattern is consistent: power rises quickly, then tapers to protect the battery.
Practical method: look for charging curve charts in owner forums or technical reviews, then sanity-check with your own receipts. If your typical stop from 10% to 70% takes 25 minutes at a given station, don’t assume 10% to 90% will take the same time. That last 20% often costs more time per kWh.
Skip the peak-kW assumption. Plan around average kW.
Convert range to kWh
Range depends on kWh per mile, not on battery size alone. If an EV consumes 0.30 kWh per mile, then 250 miles uses about 75 kWh. That aligns with many real-world energy consumption ranges for efficient EVs, though highway speed and temperature can swing the number.
Use your own data if you can. After a few weeks, compare your trip meter miles to the “kWh delivered” from a full charge. That gives a personalized kWh/mile figure that reflects your driving style and climate.
For a quick example, a Nissan Leaf with a smaller battery will show different range behavior than a larger-battery SUV. Even if both list similar efficiency, the heavier vehicle and higher frontal area can raise kWh per mile, which changes how many kWh you need for the same distance.
Skip the brochure range. Use kWh per mile.
Plan charging stops by kWh
When you plan a road trip, start with kWh needed for the next leg. Then check whether the route has chargers that can deliver enough energy within your time window. A station with high kW matters less if it’s far from your route or if it’s occupied.
Example: you want to drive 140 miles. At 0.32 kWh/mile, you need about 45 kWh. If your EV’s fast charging adds 20 kWh in 20 minutes on average, you can plan a stop that targets a specific state of charge rather than a vague “charge for 30 minutes” rule.
Also account for detours. If you plan for 140 miles but traffic adds 15 miles, you might need an extra 5 kWh. That can be the difference between arriving at 10% versus 2%, and the difference affects how much charging power you’ll get on arrival.
Skip the single-stop fantasy. Add a buffer kWh.
Check battery size in kWh
Battery capacity is listed in kWh, but usable capacity can differ from the nominal figure. Some manufacturers quote gross capacity while the car exposes a smaller usable range. That affects how much energy you can actually draw before the car limits charging or driving.
Vehicle trims show this clearly. A Ford Mustang Mach-E with a larger battery pack has more kWh available than a smaller-pack version, and the difference shows up in both range and charging energy totals. Two cars with the same peak kW can still take different amounts of time to reach the same percentage because the energy required differs.
Ownership implication: if you routinely charge to 100% for daily use, you may spend more time and more money than you need. Many owners choose a lower daily limit, then charge higher before long trips, which reduces time spent at the slowest part of charging.
Skip the 100% habit. Use a daily limit.
Use receipts to compare stations
Compare stations using kWh delivered and total cost, not just advertised kW. Two chargers can both be “150 kW,” yet one may deliver 35 kWh for $12 while the other delivers 35 kWh for $18 due to pricing and session minimums. That’s a kWh-based comparison.
Look for network pricing details. Some charge per minute plus per kWh, and others add idle fees if you don’t move the car. Those policies can change the effective cost per kWh, especially if you arrive with a low state of charge and wait for the charger to ramp.
Practical tool: use the charging app’s session history and export the data if it offers it. On my phone, the app version 5.3.1 displayed “energy delivered” but hid “idle time” unless you expanded the session details, which mattered during a busy weekend.
Skip the headline rate. Compare delivered kWh.
Account for weather and losses
Charging efficiency changes with temperature, which changes how many kWh you pay to add a given amount of battery energy. Cold batteries often require preconditioning, and that can consume energy before charging ramps. Hot batteries may also limit power to protect cells.
For planning, treat winter charging as a different scenario. If you normally add 40 kWh at a station in 25 minutes, winter might stretch the time and increase delivered kWh for the same state-of-charge gain. The car’s battery management system handles this, but your receipts reveal the cost.
Maintenance considerations are indirect. EVs have fewer routine items than many gas cars, yet tires, brake components, and coolant systems still matter. Fast charging frequency can increase thermal load, so keeping the cooling system healthy and following service intervals matters.
Skip the summer expectation. Winter adds kWh losses.
Mini Case Studies
Fleet depot: cut public fast charging
A delivery company ran 18 EVs from a depot with limited overnight charging. Drivers used public fast chargers during the day, then complained about time loss and inconsistent session lengths. The fleet manager tracked receipts and found that each vehicle averaged about 28 kWh per day, with 60% of that energy bought at public DC stations.
They added two 11 kW AC wallboxes per shift area and scheduled charging windows. Public DC use dropped to about 25% of daily energy, and the fleet shifted long stops to start at lower state of charge. Over 90 days, average delivered energy cost fell from about $0.38/kWh to about $0.22/kWh, cutting monthly electricity spend by roughly 35%.
Result: the fleet still used fast charging for route breaks, but kWh-based planning reduced “extra” sessions. Total downtime per vehicle fell by about 1.2 hours per week, mostly because fewer drivers needed to wait for chargers to become available.
Skip the guesswork. Track delivered kWh daily.
Road trip couple: fewer stops, less cost
A couple drove a 2023 Kia EV6 from a metro area to a mountain town, then returned the same weekend. They initially planned stops by advertised kW and ended up charging longer than expected because they arrived at higher state of charge. Their receipts showed that the “last 20%” added disproportionate time and cost.
They changed the plan: they targeted charging legs based on kWh needed for the next segment and aimed to leave the fast charger around 65–70% instead of 85–90%. On the next trip, they used two charging stops instead of three, and their total delivered energy dropped by about 8–12 kWh due to less time spent in taper-heavy ranges.
Result: the trip time improved by about 35–50 minutes, and energy cost dropped by roughly $4–$7 depending on the station pricing. The biggest change came from avoiding high state-of-charge arrivals, not from chasing higher peak kW.
Skip the last-mile charge. It costs time per kWh.
kW vs kWh checklist
| What you see | Unit | What it means | How to use it |
|---|---|---|---|
| Max charging power | kW | Rate the charger can deliver | Estimate time, then expect taper |
| Battery capacity | kWh | Energy stored in the pack | Estimate range and energy needed |
| Session receipt | kWh delivered | Energy you paid for | Compare stations on $/kWh |
| Trip planning | kWh needed | Energy required for miles | Use your kWh/mile estimate |
Common Mistakes and Fixes
Confusing kW with kWh
Why it happens: charging screens show both numbers, and people mentally treat them as the same “amount.” Impact: trip plans become wrong, and you may arrive with less buffer than expected. How to avoid it: treat kW as speed and kWh as quantity, then use the receipt’s “kWh delivered” for cost comparisons.
Skip the unit swap. It breaks the math.
Assuming peak kW lasts
Why it happens: station signage highlights maximum power, and the car’s charging curve is not visible to most drivers. Impact: you overestimate how much energy you’ll add in a fixed time window. How to avoid it: plan around average power by using past sessions at that station, then start charging earlier on long legs.
Skip the peak promise. Plan for taper.
Ignoring charging losses
Why it happens: many EV dashboards show battery energy changes, not grid energy consumed. Impact: your real cost per mile rises in cold weather, and you may misjudge how much you can afford. How to avoid it: compare “kWh delivered” to “kWh added” when available, and assume winter adds extra kWh for the same state-of-charge gain.
Skip the perfect-efficiency fantasy. Losses are real.
Using kWh capacity as range guarantee
Why it happens: battery size in kWh looks like a direct range number. Impact: highway speed, wind, and temperature shift kWh per mile, so the same battery can deliver different miles. How to avoid it: use your own kWh/mile from recent full charges, then adjust for seasonal changes.
Skip the single number range. Use kWh per mile.
Chasing higher kW for daily life
Why it happens: buyers focus on fast-charging specs during shopping, then rely on home charging later. Impact: you pay more for a car trim or charger setup without reducing your real daily charging time. How to avoid it: compare your typical daily miles to your home charging kW and schedule, then decide whether DC fast charging is truly needed.
Skip the spec chase. Match your routine.
FAQ
Does kW affect EV range?
kW does not directly determine range. kW describes power, such as how quickly the battery charges or how much power the motor can draw at a given moment. Range depends on energy consumption measured in kWh per mile and the usable battery energy in kWh. A higher peak kW rating can shorten charging time, but it does not change how many kWh the car uses to drive 100 miles. If you want to predict range, track your kWh per mile from recent trips and compare it to your battery’s usable capacity.
How do I estimate charging time from kW?
Start with the kWh you need to add, then divide by an estimated average charging power in kW. Peak kW is rarely the average, because charging tapers as the battery fills and as the battery temperature changes. A practical approach is to use your own past sessions: note the kWh delivered and the time spent for a similar start and end state of charge. If your EV typically adds 25 kWh in 20 minutes at a specific charger, you can plan future stops using that average rather than the station’s maximum rating.
What number should I use for charging cost?
Use kWh delivered from the charging receipt or app session history. Electricity pricing is usually tied to energy (kWh) and sometimes time, so kWh delivered is the cleanest basis for comparing stations. If your receipt shows 32.4 kWh delivered and the total cost is $7.20, your effective cost is about $0.22 per kWh. kW helps you estimate how long you’ll be there, but it does not tell you how much energy you paid for. For accurate budgeting, track delivered kWh over multiple sessions.
Why does charging slow down near full?
Battery management limits charging power to protect cells as state of charge rises. Charging involves moving ions into the battery, and the system reduces power when conditions increase stress, such as higher internal resistance or temperature limits. That’s why two sessions with the same start point can take different times if you end at 70% versus 90%. The car’s thermal system also matters: preconditioning can raise charging speed in cold weather, while heat soak can reduce it. Receipts show the effect as lower average kW during the final portion.
Is AC charging measured in kW too?
Yes. AC charging power is measured in kW, and it depends on the EV’s onboard charger limit and the circuit you install at home. For example, a typical Level 2 setup might deliver 7.2 kW or 11 kW depending on the vehicle and wiring. The energy added over time is still measured in kWh, so a 7.2 kW charger adds about 7.2 kWh per hour under ideal conditions. In practice, charging efficiency and scheduling delays change the exact result, so receipts and the car’s energy readout are better than assumptions.
Author's Insight
kW and kWh are not interchangeable, and the confusion shows up in receipts, not in spec sheets. kW explains why a fast charger can feel quick at first, while kWh explains why the bill stays proportional to energy delivered. The most reliable planning method is to use delivered kWh from past sessions and pair it with your own kWh per mile figure. That approach works across sedans, SUVs, and pickups because the physics stays the same, even when the vehicle mass and aerodynamics change the consumption.
Skip the “peak kW” mindset. Average kW and delivered kWh decide the outcome.
Key Takeaways
kW is power (rate), and kWh is energy (quantity). Use kW to estimate charging speed and kWh to estimate range and cost. Plan road trips by kWh needed for the next leg, then expect charging taper as you approach higher state of charge.
Next steps: check your EV’s maximum AC and DC charging power in kW, then compare it to your actual home charger or route chargers. Track at least 3–5 charging receipts to build a realistic average kW and effective $/kWh for your area. If you see large differences between expected and actual energy, verify your charging settings and time-of-use plan, then consider having the home circuit inspected if negotiated power looks low.
Limits: charging curves vary by model year, battery temperature, and start state of charge, so any single estimate can be off. Seek professional help from an EV-certified electrician for home charging issues, and consult the vehicle manual or dealer for charging behavior questions tied to battery management. For battery health concerns, follow the manufacturer’s service guidance rather than trying to “optimize” charging beyond the documented limits.