Charging Speed Basics
Charging speed is not a single number. It changes with charger level, the vehicle’s maximum charge rate, and battery temperature. A Level 1 setup typically uses about 120V AC and draws around 12–16A, which lands near 1.4–1.9 kW. Level 2 uses 240V AC and commonly reaches 6–19 kW, depending on the car and wiring.
DC fast charging is different. It feeds high-voltage DC directly to the battery through the car’s DC charging system, so the car can accept much higher power. Many public networks advertise 150 kW or 350 kW, but the vehicle often limits the real rate. For example, a 75 kWh battery might gain roughly 10–30% in the first 15–20 minutes on a fast charger, then slow down as the battery approaches higher states of charge.
Vehicle type matters more than many buyers realize. A compact EV with a smaller battery and a higher onboard AC charger can “feel” faster at home than a larger-battery model that charges slowly on Level 2. Fleet operators also see this: if a car spends 8 hours parked overnight, the home charging rate determines whether it returns to full for the next shift.
Two industry facts shape expectations. First, charging power usually tapers as the battery fills to protect cells and manage heat. Second, the same charger can deliver different rates to different models because the car controls the maximum current and voltage it will accept.
Where Buyers get Stuck
People often compare charger labels without checking the car’s limits. A “Level 2 ready” car might still cap AC charging at 7.2 kW, which turns a full overnight charge into a longer project. Another common mistake is assuming DC fast charging stays at the advertised peak power for the whole session.
Real-world consequences show up in schedules. If a vehicle needs 60 miles of range and the home charger adds only 10–15 miles per hour, the driver may still wake up short after a late-night return. On the road, a plan that assumes “20 minutes to 80%” can stretch to 35–45 minutes if the battery is hot, cold, or already near mid-charge.
Financially, slow charging can push more miles onto paid charging. Public DC fast charging often costs more per kWh than home electricity, and time spent waiting is a hidden cost for commuters. If you drive 12,000 miles per year and your EV averages 3.0 mi/kWh, that’s about 4,000 kWh annually. A 10–20% difference in charging cost can move yearly energy spend by hundreds of dollars.
Maintenance considerations also tie in. Frequent fast charging increases battery thermal cycling, and while modern EVs manage this well, it can still affect long-term degradation more than mostly Level 2 charging. The practical risk is not “battery failure,” it’s that your usable range may drop faster than expected if you rely on DC charging every day.
How to Charge faster
Match the charger to the car
Start with the vehicle’s maximum AC and DC charge rates. A car that tops out at 7.2 kW on Level 2 will not benefit from a 19.2 kW wall unit beyond the car’s limit. In practice, check the owner’s manual or the spec sheet for “AC charging power” and “DC fast charging maximum.”
Why it works: the car’s onboard electronics decide how much power it can safely draw. What it looks like: your charging app may show 7 kW even when the station is capable of 11 kW or more. Tools: use the car’s charging screen and compare it to the charger’s displayed output.
Outcome: you avoid paying for a higher-power setup that never reaches the car’s acceptance rate. This matters for ownership costs, because a higher-power Level 2 install can require electrical upgrades.
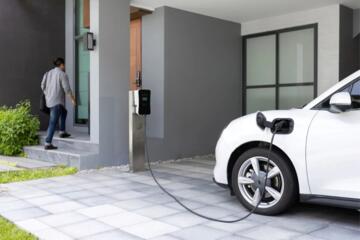
Use Level 2 for daily needs
For most drivers, Level 2 is the best time-to-cost trade. A typical 240V home charger at 7.2–11 kW can add roughly 25–50 miles of range per hour, depending on the EV’s efficiency and battery size. If your commute is 30–40 miles, you can often recover daily miles overnight without touching DC fast charging.
Why it works: Level 2 keeps battery temperatures steadier than repeated DC sessions. What it looks like: you plug in after work and wake up with a predictable charge level. Tools: schedule charging in the car or charger app to start during off-peak electricity windows.
Outcome: fewer public charging stops and less time spent waiting. Mild frustration shows up when people forget to set the schedule and then pay peak rates.
Plan DC charging around taper
DC fast charging is fastest early, then slows as the battery fills. Many EVs show a noticeable drop after reaching around 50–60% state of charge, even on high-power stations. Plan to charge to a mid-level for road trips, then top up again later.
Why it works: the battery management system reduces current to manage heat and cell stress. What it looks like: the station may advertise 150 kW, but the car might accept 120 kW at first and then fall to 60 kW near 80%. Tools: use the charging route planner in the navigation system or a network app to see expected charge curves.
Outcome: shorter total trip time than “charge to 100% at the first stop.” This is where assumptions break, because the taper is vehicle-specific.
Precondition the battery when possible
Some EVs can precondition the battery before DC charging, which helps the car accept higher power sooner. If the battery is very cold, the car may limit charge rate to protect cells. If the battery is very hot, it may also reduce power until temperatures stabilize.
Why it works: preconditioning brings the battery closer to the optimal temperature range for fast charging. What it looks like: you may see a “preconditioning” indicator and a slightly higher energy draw before you arrive. Tools: set the navigation to the fast charger so the car can start preconditioning automatically.
Outcome: more consistent fast-charge rates, especially in winter. I’ve seen this matter on a 30°F morning, where the first 10 minutes at a DC station can be dramatically slower without preconditioning.
Check connector and station limits
Not all DC stations deliver the same power to every port. A 350 kW site may split power between two stalls, and the active port can cap output based on how many chargers are in use. Also, some vehicles use different charging standards or maximum rates, which affects what you can actually pull.
Why it works: station hardware and network configuration decide the available output. What it looks like: the station display might show “up to 350 kW,” while your car shows a lower acceptance rate. Tools: read the station’s port details in the network app, and watch the car’s live charging power.
Outcome: fewer surprises when a “full power” station is busy. It rarely works the way the docs say when multiple vehicles arrive at once.
Optimize home installation for real output
Level 2 speed depends on wiring, breaker size, and charger model. A 40A circuit can support higher charging rates than a 30A setup, but the car still caps the maximum it will draw. If you install a charger that matches your car’s limit, you avoid paying for unused capacity.
Why it works: voltage drop and circuit limits affect how much power the charger can safely deliver. What it looks like: your electrician may recommend a load calculation if you have other high-draw appliances. Tools: ask for a permit and a load assessment, then confirm the charger’s rated output.
Outcome: stable charging without tripping breakers. This is where “it charges” becomes “it charges on schedule,” which is what you feel day to day.
Track kWh and cost, not minutes
Charging time is a poor proxy for cost because power varies during a session. Instead, track kilowatt-hours (kWh) and your local electricity rate. If your EV uses about 3.0 mi/kWh, then 100 miles consumes roughly 33 kWh. At $0.30/kWh, that’s about $10; at $0.45/kWh, it’s about $15.
Why it works: kWh reflects energy delivered, while minutes reflect a changing power curve. What it looks like: your charging app shows kWh added and average power. Tools: compare home utility rates, off-peak plans, and public charging pricing per kWh plus any session fees.
Outcome: better budgeting and fewer “why did this cost more?” moments. It also helps you decide whether a longer Level 2 session beats a short DC top-up.
Use the right charge targets
Battery longevity improves when you avoid sitting at very high state of charge for long periods. Many owners set a daily target around 70–90% for commuting, then charge to 100% only before a long trip. This reduces time spent in the taper zone and can reduce charging stress.
Why it works: the battery management system manages stress, and time at high voltage is one factor in degradation. What it looks like: your car finishes charging earlier, so it spends less time near the top. Tools: use the car’s departure timer and charge limit setting.
Outcome: predictable mornings and fewer unnecessary fast-charge sessions. The trade-off is range planning, especially for households with back-to-back trips.
Mini Case Examples
Fleet depot: predictable Level 2
A delivery company ran 12 EVs on a two-shift schedule. The depot had Level 2 chargers rated for 11 kW, but drivers often left cars unplugged until late evening. The company added a departure-time charging rule in the vehicle settings and required plug-in immediately after return.
Result: each vehicle gained enough energy overnight to cover the next shift with fewer DC fast charges. Over 3 months, DC charging sessions dropped from about 2 per vehicle per week to about 0.5 per week. Energy cost fell roughly 12% because home electricity pricing beat DC rates, and the waiting time at public stations dropped.
Road-trip habit: mid-charge stops
A commuter used DC fast charging for weekend travel and routinely charged to 100% at the first stop. The driver switched to charging to about 60–70% at the first station, then topped up later. The change matched the vehicle’s observed taper behavior, where power fell sharply after mid-charge.
Result: total trip time decreased by an estimated 20–30 minutes on a 300–350 mile route. The driver also reduced charging session fees by shortening time at stations that charge by minute or by session. Battery health concerns eased because the car spent less time at the highest state of charge.
Charging Speed Checklist
| Decision point | What to check | Why it matters | Quick test |
|---|---|---|---|
| Level 2 at home | Car’s max AC kW and your circuit amperage | Prevents paying for unused capacity | Watch live kW after plug-in |
| DC fast charging | Car’s max DC kW and expected taper | Peak power rarely lasts | Plan to stop at 60–80% |
| Battery temperature | Preconditioning support and winter behavior | Cold packs can cut charge rate | Set nav to charger before arrival |
| Station power sharing | Port pairing limits on the network app | Busy sites reduce output | Check port status before pulling in |
Common Mistakes and Fixes
Buying a higher-power Level 2 charger than the car can accept happens when people shop by wall-unit specs alone. The impact is wasted installation cost and no change in daily charge time. Avoid it by matching the charger’s rated output to the vehicle’s maximum AC kW, then confirm the circuit amperage with an electrician.
Another mistake is planning road trips by “charger speed” instead of “charge curve.” The impact is arriving later than expected, especially when the battery is already warm or near mid-charge. Avoid it by targeting 60–70% at the first stop and using the car’s navigation to precondition when available.
People also forget that public charging pricing can include session fees. The impact is higher bills even when kWh delivered looks similar. Avoid it by comparing total cost per kWh and per minute, then tracking kWh added in the app. A mild frustration shows up when the receipt doesn’t match the estimate.
Finally, some drivers set a 100% daily charge and leave the car sitting. The impact is extra time at high state of charge, which can increase long-term wear. Avoid it by using a departure timer and a daily cap like 80–90%, then charging to 100% only before long trips.
FAQ
How fast is Level 1 charging?
Level 1 uses a standard 120V outlet and typically charges at around 1.4–1.9 kW for many EVs. The exact rate depends on the vehicle’s onboard charger and the outlet’s circuit limits. In practice, a small EV might add roughly 3–5 miles of range per hour, while a larger battery can be closer to 2–4 miles per hour. Level 1 works for short commutes, but it often cannot recover a full day of driving if you arrive home with low state of charge.
What determines Level 2 charging speed?
Level 2 speed depends on the car’s maximum AC charging power, the charger’s output rating, and the electrical circuit installed at home. A car that caps at 7.2 kW will charge at about that rate even if the wall unit can do more. Wiring and breaker size matter because voltage drop can reduce output or trigger protection. In practice, check the live charging power on the car screen after plug-in, then compare it to the expected kW from the installation.
Why does DC fast charging slow down?
DC fast charging slows because the battery management system reduces current as the state of charge rises and as temperature moves away from the ideal range. Higher voltage near the top of charge increases stress, so the car limits acceptance. Cold batteries also reduce charge rate until they warm up. On many EVs, the first 10–20 minutes deliver the highest power, then the rate tapers toward 70–80% and beyond.
Do 150 kW and 350 kW stations charge the same?
They do not charge the same in real terms. A 350 kW station can still deliver less if the vehicle’s maximum DC acceptance is lower, or if the station splits power between ports. The car controls the actual current and voltage it draws, so two different EVs can show different kW on the same charger. The best approach is to watch the car’s live charging power and plan stops based on the vehicle’s taper behavior, not the station’s marketing number.
How should I plan a road trip?
Plan around mid-charge stops and expected taper. For many EVs, charging to about 60–70% at the first stop shortens total time versus charging to 100% early. Use the car’s navigation to route through chargers and trigger preconditioning when available. Also check whether the charger is likely to be busy, because shared power can reduce output. Track kWh and average power so you can adjust the next stop if conditions differ.
Author's Insight
Charging speed is a system outcome: the station’s available power meets the car’s acceptance limits, then the battery management system shapes the curve. That’s why two EVs on the same DC fast charger can show different kW, and why the “peak” number rarely matches the session average. I’d treat Level 2 as the default for daily miles and reserve DC fast charging for gaps in the schedule. For planning, I’d rather estimate kWh needed and target 60–80% than count on a single time-to-percentage assumption.
Key Takeaways
Match charger level to the vehicle’s real limits, not the charger’s headline rating. Use Level 2 for routine charging, then plan DC fast stops around taper and battery temperature. Track kWh and total cost so you can compare home electricity versus public charging without guessing.
Next steps: check your EV’s maximum AC and DC charging specs, verify your home circuit amperage, and test your charging rate once after installation or purchase. If you see repeated low charging power, inspect the charging cable, confirm the outlet or circuit rating, and try a different station. Seek professional help from a licensed electrician for wiring issues, and consult the vehicle’s service documentation if charging behavior changes suddenly or shows warning messages.