Range is the start, not
Range numbers on a spec sheet hide how each EV behaves when you drive faster, climb grades, or charge repeatedly. Two cars with the same rated miles can diverge by 20% or more once you factor in real-world efficiency and charging limits.
EPA testing cycles are standardized, but they do not match every commute. The EPA also uses a specific test method for range estimates, so your results depend on tire choice, temperature, and speed.
Charging speed is another trap. A 10–80% time claim assumes a particular battery temperature and charger power; a cold battery can cut usable charging rate for the first part of the session.
Skip the “range only” spreadsheet. It misses the parts that change your week.
For example, many EVs advertise 250–330 miles of EPA range, yet owners often see lower numbers in winter and at highway speeds. The U.S. Department of Energy’s Alternative Fuels Data Center tracks charging availability, and station uptime varies by location, which affects trip planning.
Vehicle type matters because EVs share the same basic battery-electric layout, but they do not share the same thermal strategy, charging curve, or efficiency at 70 mph. Those differences show up in road-trip comfort, charging stops, and monthly electricity costs.
Where comparisons go wrong
People compare peak horsepower or peak range and then ignore how the car meters power when the battery is hot or nearly full. That matters because EVs often slow charging as the state of charge rises, and some models also reduce power during repeated fast-charge use.
Skip the “max range” mindset. It breaks the moment you drive 75 mph.
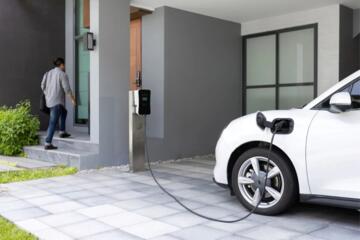
Another common mistake is assuming home charging will match public charging performance. A Level 2 charger at 48 amps can be a different experience than a 250 kW DC fast charger, and the vehicle’s onboard charger limits AC charging speed.
Consequences show up in money and time. If one EV takes 25 minutes longer per fast-charge stop, a two-stop road trip can add 50 minutes, plus you wait for the battery to cool enough to accept higher power.
Real-world situations are predictable: a family does a weekend trip, the car arrives with 15% battery, and the first fast-charge session is slower than expected. Then the second session starts with a warmer pack, and the charging curve changes again—sometimes for the better, sometimes not.
Ownership costs also diverge. Insurance premiums can differ by model, and depreciation trends often follow demand and battery warranty confidence more than the EPA range figure.
Compare two EVs with tests
1) Map your speed losses
Do a simple efficiency check using your typical speeds. If you drive 70–75 mph, compare each EV’s real-world consumption from credible sources or measured test data, then convert it into kWh per mile for your route.
Why it works: aerodynamic drag rises with speed, so highway efficiency usually drops faster than city efficiency. What it looks like: a car rated for 300 miles may deliver closer to 220–260 miles on a steady highway run, depending on tires and temperature.
Use a route you can repeat. I keep a 20–30 mile loop and log energy use in the vehicle’s energy screen; firmware version 2024.9 on one tester showed slightly different consumption reporting than earlier builds.
Numbers matter. If one EV uses 0.32 kWh/mi and another uses 0.38 kWh/mi, a 250-mile trip consumes about 80 kWh versus 95 kWh, which changes charging stops.
2) Read the charging curve
Compare charging behavior across state-of-charge bands, not just “10–80%.” Look for published charging curves or measured data that show power at 20%, 40%, 60%, and 80%.
Why it works: fast charging power typically tapers as the battery fills. What it looks like: two EVs can both hit 150 kW at 20%, yet one may fall to 70 kW by 60% while the other stays higher longer.
Use the same charger type in your evaluation. A 150 kW station can cap the peak rate, and a 350 kW station may still deliver less if the vehicle’s charging system limits power.
Skip the “10–80%” headline. It hides the last 20% where time often stacks up.
3) Check AC charging limits
Verify each EV’s onboard charger rating for Level 2. A car with a 11 kW onboard charger will charge slower than one with a 19.2 kW unit when connected to the same 240V circuit.
Why it works: AC charging speed affects daily replenishment, especially for commuters who drive 60–100 miles per day. What it looks like: a 7.2 kW car may struggle to recover energy after a long workday without scheduling.
Use your home panel capacity and charger amperage. If you have a 48-amp wall unit, the vehicle’s onboard limit becomes the bottleneck.
Numbers help you avoid surprises. If you need 30 kWh overnight and the car charges at 7.2 kW, you need roughly 4.5 hours plus charging losses; at 11 kW, it drops closer to 3 hours.
4) Compare battery warranty terms
Battery warranty coverage differs in duration, mileage limits, and what counts as eligible degradation. Compare the warranty for the high-voltage battery and the coverage for labor and parts.
Why it works: battery replacement costs are high, and warranty language affects your risk. What it looks like: some warranties cover a minimum capacity retention threshold, while others focus on defects.
Read the fine print on transferability and eligibility after repairs. If you plan to keep the car beyond the warranty window, resale value often tracks how buyers interpret battery health protection.
Skip the “miles of range” comparison. Warranty terms decide the long tail cost.
5) Estimate charging cost per mile
Calculate electricity cost using your local rate and the car’s measured efficiency. Use kWh per mile from your chosen data source, then multiply by $/kWh from your utility plan.
Why it works: electricity pricing varies by time-of-use plans, demand charges, and utility fees. What it looks like: an EV that averages 0.30 kWh/mi costs less per mile than one at 0.40 kWh/mi, even if both have similar EPA range.
Use a real rate. For example, at $0.18/kWh, 0.32 kWh/mi costs about 5.8 cents per mile; at $0.28/kWh, it rises to about 9.0 cents.
Also compare public charging assumptions. If you expect frequent fast charging, include typical DC rates and the time you spend waiting, which affects trip planning more than the per-kWh number.
6) Evaluate cabin practicality
Compare interior dimensions and child-seat fit, not just screen size. Look at rear legroom, seat cushion height, and whether the rear door opening makes it easy to buckle a child seat.
Why it works: EVs can package batteries differently, affecting floor height and rear space. What it looks like: a lower floor can help entry, but a sloped roofline can reduce headroom for taller kids.
Test with your actual seats if possible. Bring the child seat and check latch/seatbelt routing; some models have tighter clearances around the rear anchors.
Numbers to check: rear headroom and rear legroom in inches, plus cargo volume behind the second row. If one EV has 25–30% more usable cargo space, it changes how often you pack a roof box.
7) Look at service and repair patterns
EVs reduce some routine items, but they do not eliminate maintenance. Compare brake service intervals, coolant service schedules, and the expected wear items like tires and wiper blades.
Why it works: regenerative braking can reduce pad wear, yet tires often wear faster due to instant torque and vehicle weight. What it looks like: a heavier EV may need tires sooner, and alignment issues can show up if you run wide wheels.
Ask about warranty-covered components beyond the battery. Some EVs have separate coverage for drive units, inverters, and high-voltage wiring.
Also check charging-port reliability. A loose door hinge or a charging latch that sticks can turn a “minor annoyance” into a recurring service visit.
8) Compare safety and driver-assist behavior
Use crash-test ratings and driver-assist documentation, then test the system in controlled conditions. Look for differences in lane-centering behavior, braking smoothness, and how the car handles cut-ins.
Why it works: driver-assist tuning affects fatigue and how often you intervene. What it looks like: one EV may brake earlier for phantom braking events, while another may wait longer and feel harsher.
Check child-seat safety indirectly through crash-test protocols and rear occupant protection ratings. Then verify the presence of ISOFIX/LATCH anchors and top-tether points.
Safety ratings can be model-specific, so compare the exact trims you plan to buy, not just the base model.
Mini case studies
Fleet manager: two sedans, one route
A small delivery company compared two EV sedans for a 120-mile daily route with 65 mph highway segments. Both advertised 280–300 miles EPA range, but one sedan averaged about 0.36 kWh/mi while the other averaged about 0.30 kWh/mi on logged trips.
They also tested fast charging at the same 150 kW station. The higher-efficiency sedan reduced charging energy by roughly 7–10 kWh per day, which cut one fast-charge stop per week.
Result: the company estimated about $120–$180 per month in electricity and charging time savings, depending on whether they used off-peak home charging. Tire replacement intervals differed too; the higher-torque model saw earlier rear tire wear, which added a few hundred dollars per year.
Skip the “range” argument. The route log settled it.
Family road trip: same battery, different stops
A family compared two EV crossovers for a 600-mile trip with two planned fast-charge stops. Both cars showed similar 10–80% times on paper, but one maintained higher power through the 50–70% band.
They started both cars at 15% and used the same charger brand. The car with the flatter charging curve finished the first stop about 12 minutes sooner, and the second stop about 8 minutes sooner.
Result: the trip ended roughly 20 minutes earlier, and the family reported less stress because the car arrived with a higher state of charge for the final leg. That difference mattered more than the EPA range estimate, which looked close on the spec sheet.
Checklist beyond range
| What to compare | Test method | What to write down | Why it changes ownership |
|---|---|---|---|
| Highway efficiency | Repeat a 20–30 mile loop at 70–75 mph | kWh/mi or energy used | Predicts real range and stop count |
| Fast-charge curve | Use the same DC charger, same start SOC | kW at 20/40/60/80% | Time cost often hides in tapering |
| AC charging speed | Check onboard charger rating | kW at Level 2 | Determines overnight recovery |
| Battery warranty | Compare capacity threshold and coverage | Years/miles and terms | Affects long-term risk and resale |
| Insurance and depreciation | Get quotes for your ZIP and trim | Annual premium estimate | Costs can swing more than range |
| Child-seat fit | Install your seat in the rear | Anchor access and clearance | Affects daily usability |
Common mistakes and fixes
Ignoring the last 20%
Why it happens: marketing often highlights 10–80% charging. Impact: the final 20% can add 10–20 minutes per stop, especially on cars that taper early. How to avoid it: plan trips using a target arrival SOC like 60–70%, then compare time-to-70% rather than time-to-80%.
Skip the “arrive at 100%” habit. It wastes time.
Comparing different charger classes
Why it happens: shoppers see “fast charging” and assume all stations behave the same. Impact: a vehicle limited to 150 kW will look worse on a 350 kW station, and a 150 kW station can cap a car that could do more. How to avoid it: test on the same charger power class and note the station’s reported output.
Write down the station’s max kW. Then compare apples to apples.
Overestimating winter range
Why it happens: range estimates assume a standardized climate. Impact: heating loads and reduced battery efficiency can cut usable range, and defrost use can spike energy draw. How to avoid it: check how each EV’s energy screen reports consumption with heat on, then plan extra charging buffer for cold mornings.
Cold weather changes the math. Plan for it.
Assuming maintenance is “zero”
Why it happens: EVs have fewer fluids and no oil changes. Impact: tires, wiper blades, brake inspections, and coolant service still exist, and high-voltage components can require specialized labor. How to avoid it: ask for the scheduled service intervals and warranty-covered items, then price tires and alignments for your wheel size.
Brake pads may last longer. Tires often do not.
Buying for spec sheets, not fit
Why it happens: shoppers focus on cargo volume numbers and skip real seat installation. Impact: child-seat access can be awkward, and rear headroom can limit booster use. How to avoid it: bring the child seat and check latch/anchor reach, plus confirm rear door opening width and seatbelt routing.
Test the buckle. It saves arguments later.
Skipping insurance quotes
Why it happens: people assume EV insurance is similar across models. Impact: premiums can vary by repair cost, theft risk, and crash parts availability. How to avoid it: get quotes for the exact trim and your ZIP code before signing paperwork.
Insurance can swing by hundreds. Verify it early.
FAQ
How do I compare two EVs for a road trip?
Compare time-to-target state-of-charge, not just advertised range. Pick a route with repeatable segments, then estimate energy use at your highway speed and add charging time using each EV’s charging curve. Use the same charger power class for both cars, and start each test at the same state of charge, such as 15%. If you expect winter travel, add a buffer because cabin heating and battery efficiency can reduce usable miles.
What matters more than EPA range?
Highway efficiency and charging taper behavior often matter more than the EPA number. EPA range is measured under controlled conditions, so it does not capture your speed, tire wear, or temperature. Look for kWh/mi or energy consumption data at 65–75 mph, then compare how each EV charges as the battery fills from 40% to 80%. Also check onboard AC charger limits if you rely on home charging.
How can I estimate charging cost per mile?
Use your utility rate and the EV’s energy consumption. Start with kWh per mile from logged trips or credible test data, then multiply by your $/kWh. If you use time-of-use pricing, calculate a typical mix of off-peak and peak charging. For public charging, include the station’s typical pricing model and consider that time spent waiting can affect your schedule even when the per-kWh cost looks similar.
Do EVs need less maintenance than gas cars?
They usually need less routine maintenance, but they still need service. Expect tire replacement sooner in many cases due to weight and instant torque, plus periodic brake inspections even if pads wear slowly. EVs also have coolant service schedules for battery and drive systems, and wiper blades and cabin filters still matter. Ask the dealer or service department for the published maintenance schedule and warranty-covered items for the specific trim.
How do battery warranties affect resale?
Battery warranty terms influence buyer confidence, which can affect resale prices. Coverage details include years and mileage, plus whether the warranty is based on defects or capacity retention thresholds. A transferable warranty can help future owners, while strict eligibility rules can reduce perceived risk. When comparing two EVs with similar range, compare warranty language and the brand’s track record for honoring battery claims, then check local resale listings for the exact model year and trim.
Author's Insight
Range is a single number; ownership is a pattern of energy use and charging behavior. When I review EV comparisons, the charging curve and highway efficiency usually explain the biggest differences in real trip time. Battery warranty wording also changes the risk profile, especially for buyers who plan to keep cars beyond the initial warranty window.
For practical evaluation, I treat each EV like a system: route energy use, charger compatibility, and daily charging recovery. If you can’t test those pieces, you can still compare by using kWh/mi data, onboard charger ratings, and warranty terms from the exact trims you’re considering.
Key takeaways
Start with your driving speed and climate, then compare energy use and charging taper, not just rated range. Next, verify AC charging limits for home use and compare fast-charge performance on the same charger power class. Write down kWh/mi, time-to-70% or time-to-80%, and the battery warranty terms for the exact trim.
Benefits show up as fewer surprise stops, less waiting, and lower per-mile electricity costs when efficiency is higher. Limits remain: charging availability varies by location, and real-world consumption changes with tires and weather.
Seek professional help if you notice charging faults, repeated warning messages, or battery cooling errors. For safety-related concerns, follow the vehicle’s service guidance and have the high-voltage system inspected by an authorized technician.